Cancer Cell Crosstalk
Cancer Cell Crosstalk
Hannah Hoffman, Joshua Gould, William Hwang, Karthik Jagadeesh, and Jimmy Guo
Broad Institute, MIT Department of Biology, Koch Institute at MIT
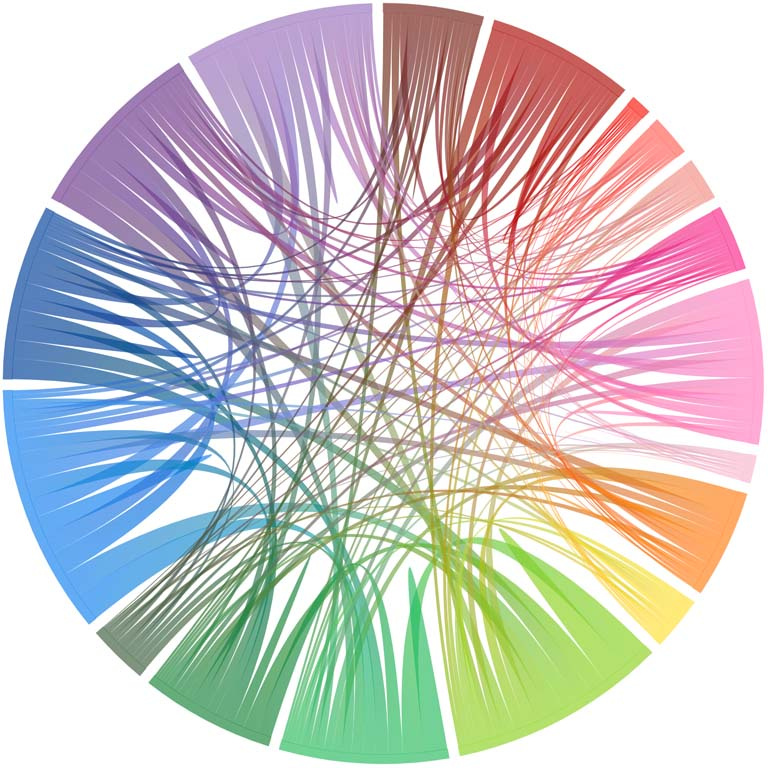
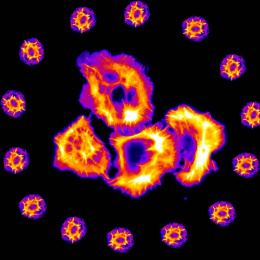
This image illustrates the relative number of interactions between common cell types found in pancreatic cancer. Each color around the circumference represents a cell type, and the thickness of a line indicates the relative frequency of interactions found between the connected cell type(s).
Over the past two years, our team of almost 50 people has worked together to build a complex dataset: the largest single-cell transcriptomic atlas of human pancreatic cancer to date. Given such a rich tapestry of information, we wanted to provide a visual overview of the intricate cell-to-cell crosstalk we were able to identify — and compare frequencies of interactions within and across cell types.
One of the larger goals of our research is to identify communication networks among cells in the pancreatic tumor microenvironment that could be targeted to treat this challenging disease. This image represents many interactions we and other scientists could seek to target in the future.