Trick Or Treat: Probing Cancer's Response to Chemotherapy
Trick Or Treat: Probing Cancer's Response to Chemotherapy
Collections: Image Award Winners, Precision Cancer Medicine
2020 Award Winner
Peter Bruno, Aslı Gökdemir, Ryan Hayman, Michael Hemann
Koch Institute at MIT, MIT Department of Biology
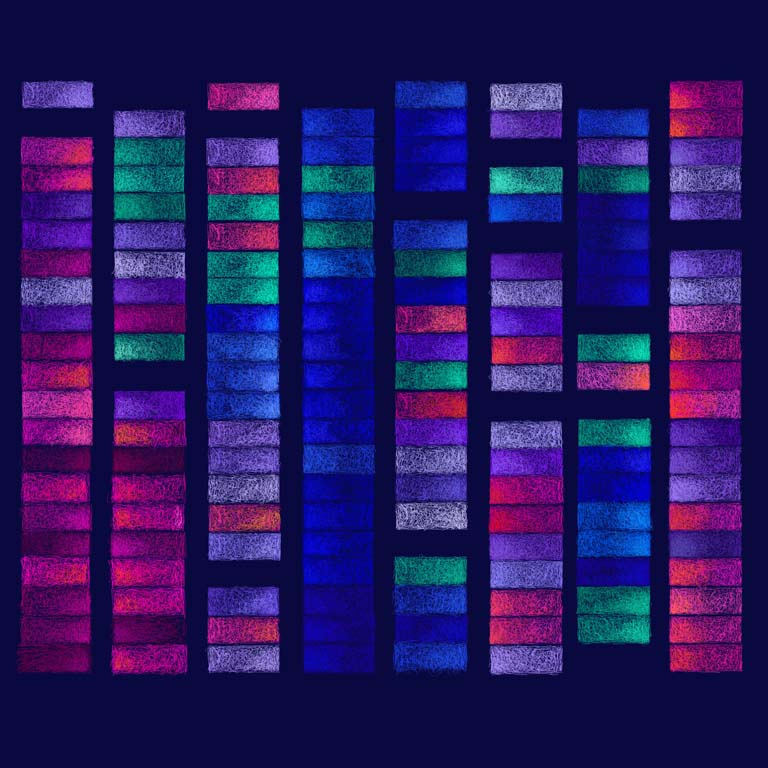
How do individual gene alterations affect a tumor’s response to treatment? Each column in the grid represents a single cell line’s vulnerability to 21 different cancer drugs (one per row), out of more than 200 tested. Blue and green show sensitivity while red and pink show resistance—the cooler the color, the more likely a cell with that mutation is to be killed by that drug. The combined data present a series of “signatures” that the Hemann Lab can use to identify how drugs work and in which patients they can be most effective.